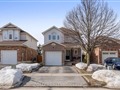
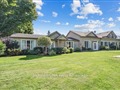
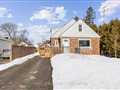
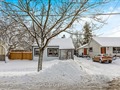
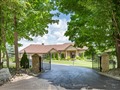
221 Mason Blvd
$906,056
Comparative Market Analysis
Jun 7, 2025
NOT AN ACTIVE LISTING
Historical Performance
| Period | $ Change | % Change |
| 1 Day | +$293 | +0.032% |
| 7 Days | +$214 | +0.024% |
| 30 Days | -$1,721 | -0.190% |
| 3 Months | -$3,664 | -0.403% |
| 6 Months | +$12.2k | +1.37% |
| 1 Year | -$47.4k | -4.97% |
| 3 Years | +$149k | +19.7% |
| 5 Years | +$284k | +45.5% |
| 10 Years | +$574k | +173% |
List My Property
Real Estate Statistics
Financing Solutions
Browsing History
13821 Dublin Line, Halton Hills
2 seconds ago
7937 Fifteenth Sdrd, Halton Hills
3 seconds ago
12998 Fifth Line, Halton Hills
4 seconds ago
148 Chuchill Rd, Halton Hills
5 seconds ago
8 Southwinds Dr, Halton Hills
6 seconds ago
13536 Fifteenth Sdrd, Halton Hills
7 seconds ago
97 Standish St, Halton Hills
8 seconds ago
19 Birchway Pl, Halton Hills
9 seconds ago
93 Rexway Dr, Halton Hills
10 seconds ago
Chantelay Crt, Halton Hills
11 seconds ago
AS SEEN ON


Are You a Licensed Real Estate Agent or Broker?